
Permission is granted to use these images/animations/sounds in news stories/blog postings concerning the LMFDB.
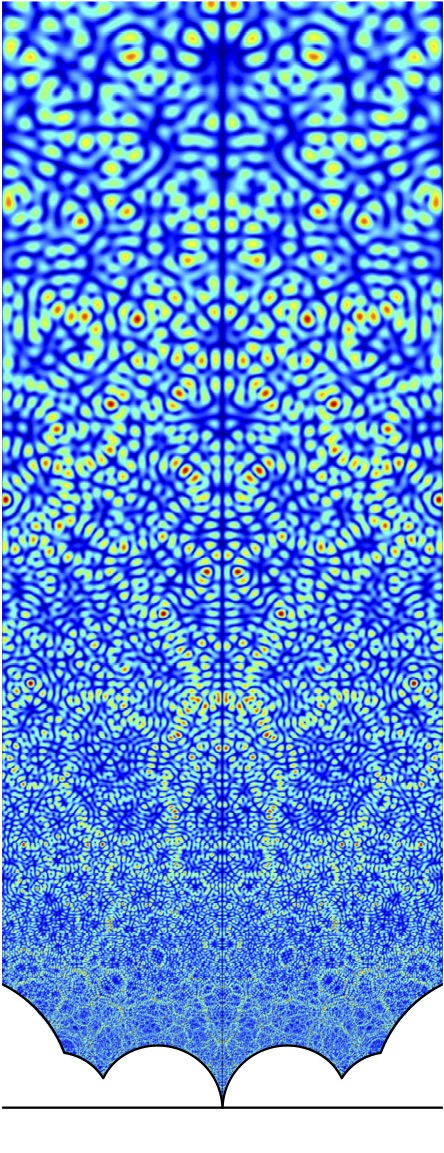
Image by Fredrik Strömberg
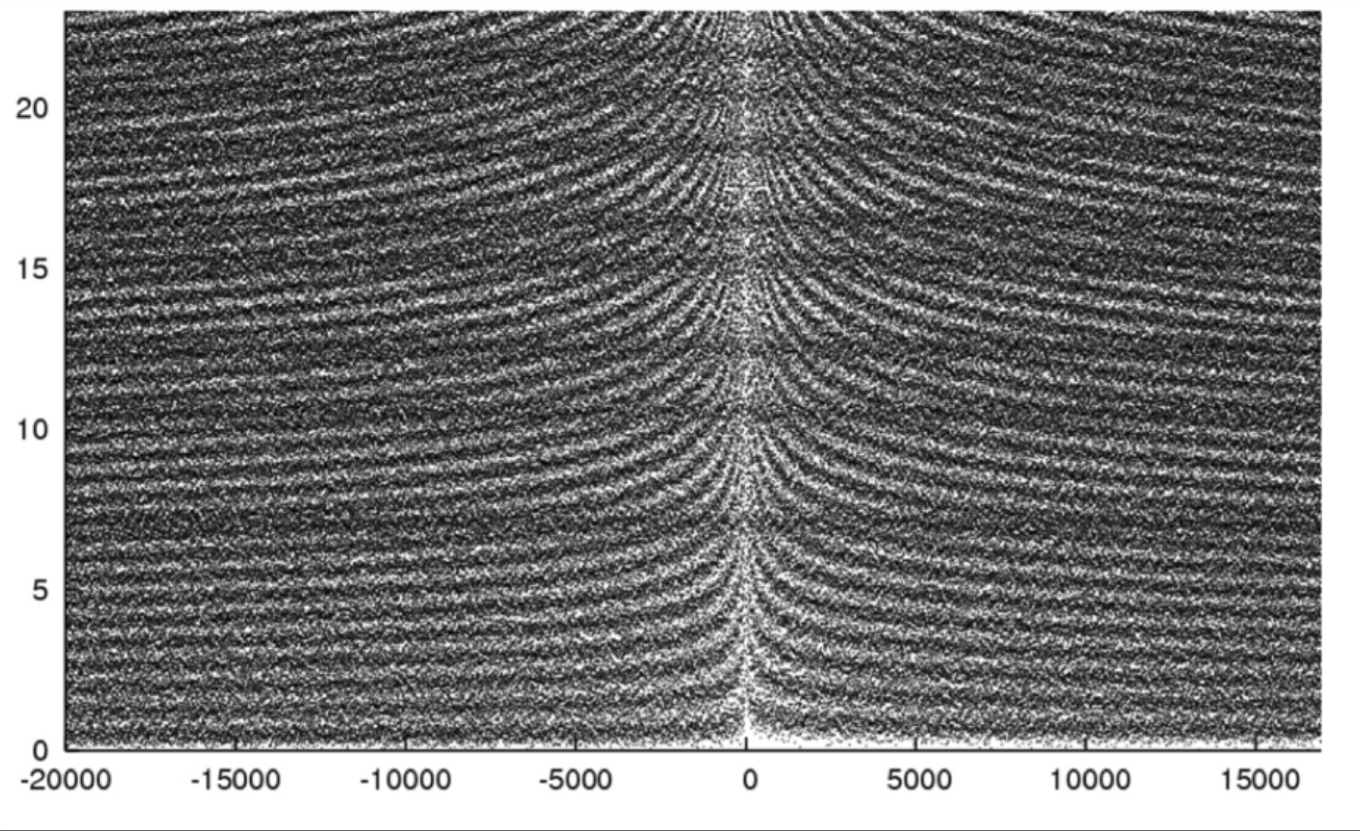
Image by Michael Rubinstein
The Riemann-Hardy Z-function from 10 to 20,000, interpreted as a sound wave.
MP3 file courtesy of David W. Farmer. Duration: 20 seconds.
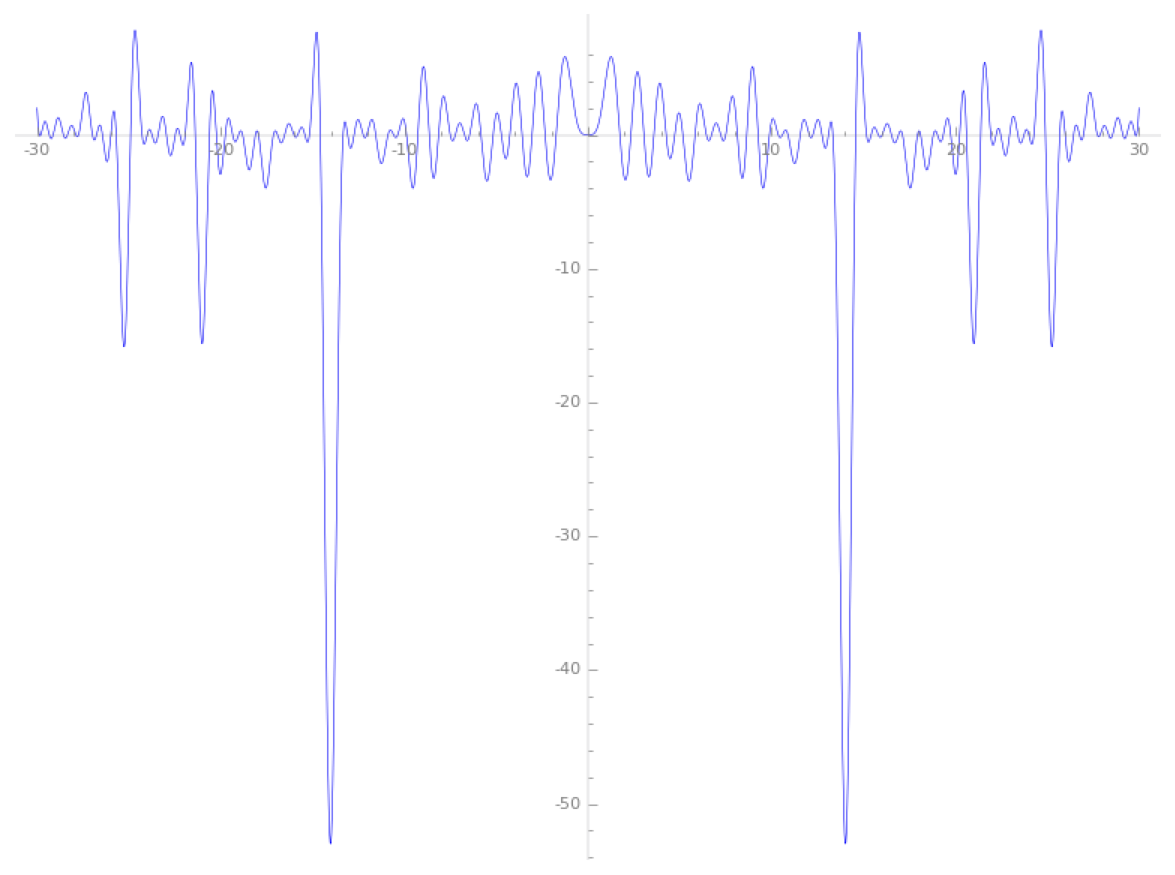
The “fangs” are due to the influence of the zeros of the Riemann zeta function.
Image courtesy of LMFDB.
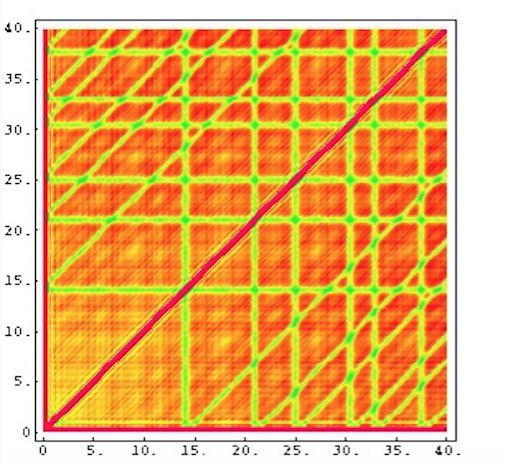
The stripes are due to the influence of the first few zeros of the Riemann zeta function on the later zeros.
Image courtesy of Nina Snaith.
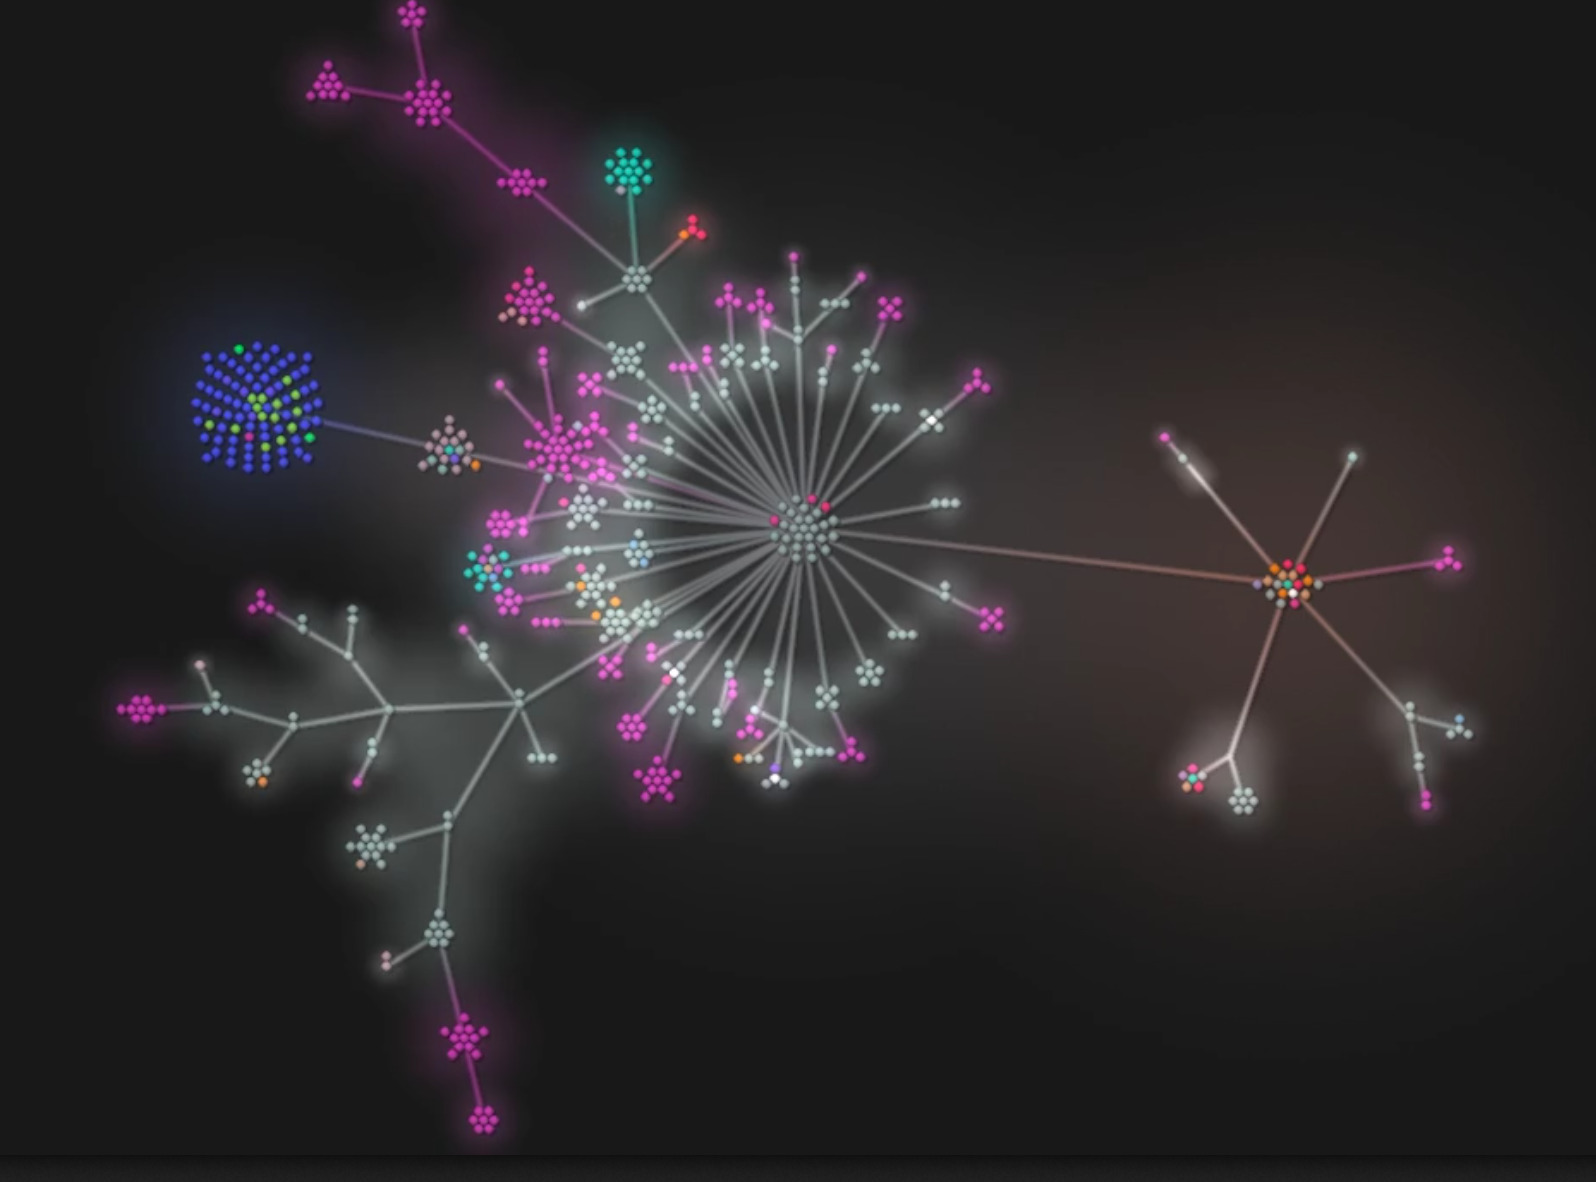
Image courtesy of Andrew V. Sutherland
Additional pictures available on Alina Bucur’s web page.